
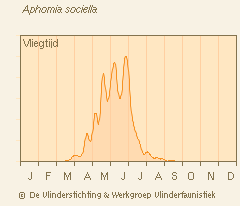
How do I create flight period charts for a specific (butterfly) species using the api ? An example of a flight period chart has been added (taken from <http://www.microvlinders.nl/soorten/species.php?speciescode=430050&p=3>. Regards, Adriaan van Os

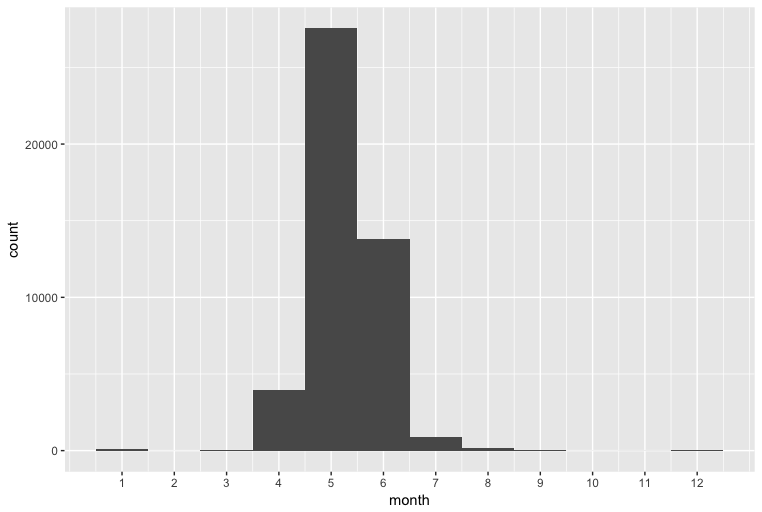
Hi Adriaan, Using the rgbif <https://ropensci.org/tutorials/rgbif_tutorial/> API client you can do: library(rgbif) library(ggplot2) o <- occ_search(scientificName = "Pyrgus malvae", limit = 200000, fields = c("name", "month")) ggplot(o$data) + geom_bar(aes(x = month), stat = "count", width = 1) + scale_x_continuous(breaks = seq(1, 12)) Best regards, Pieter On 5 April 2018 at 16:07, Adriaan van Os <adriaan@adriaan.biz> wrote:
How do I create flight period charts for a specific (butterfly) species using the api ? An example of a flight period chart has been added (taken from <http://www.microvlinders.nl/soorten/species.php?speciescode =430050&p=3>.
Regards,
Adriaan van Os
_______________________________________________ API-users mailing list API-users@lists.gbif.org https://lists.gbif.org/mailman/listinfo/api-users
Pieter Provoost wrote:
Hi Adriaan,
Using the rgbif <https://ropensci.org/tutorials/rgbif_tutorial/> API client you can do:
Thanks, Adriaan van Os
participants (2)
-
 Adriaan van Os
 -
 Pieter Provoost